Maps
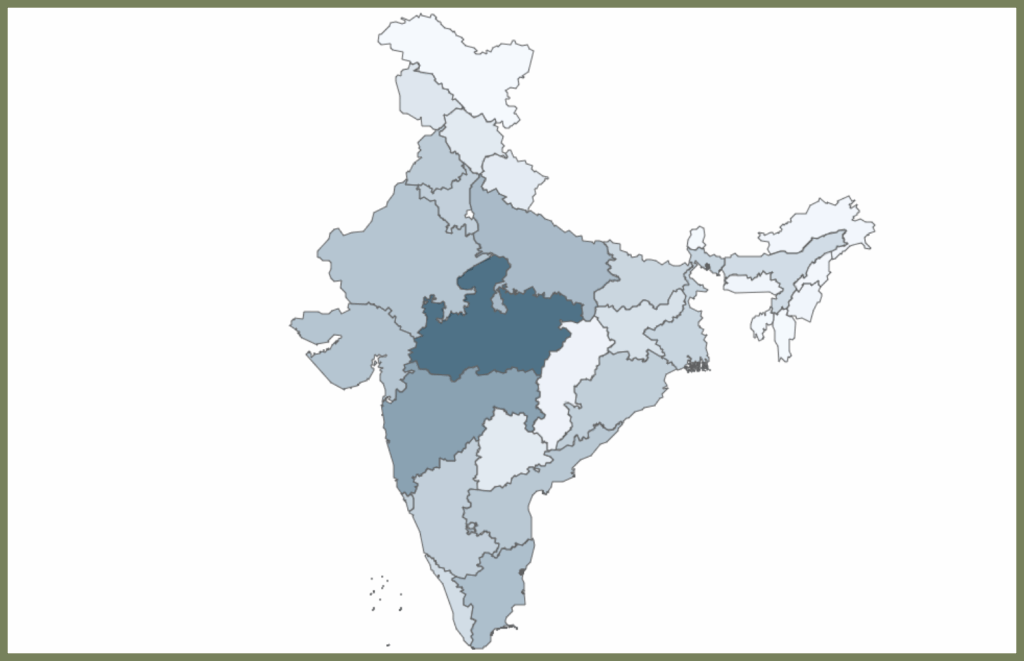
India Sand Watch is an environmental accountability project, protecting India’s rivers from unsustainable and destructive sand mining. The project combines public information with outputs from advanced machine learning models to create evidence, enabling informed media reporting, research, policy making and collective action.
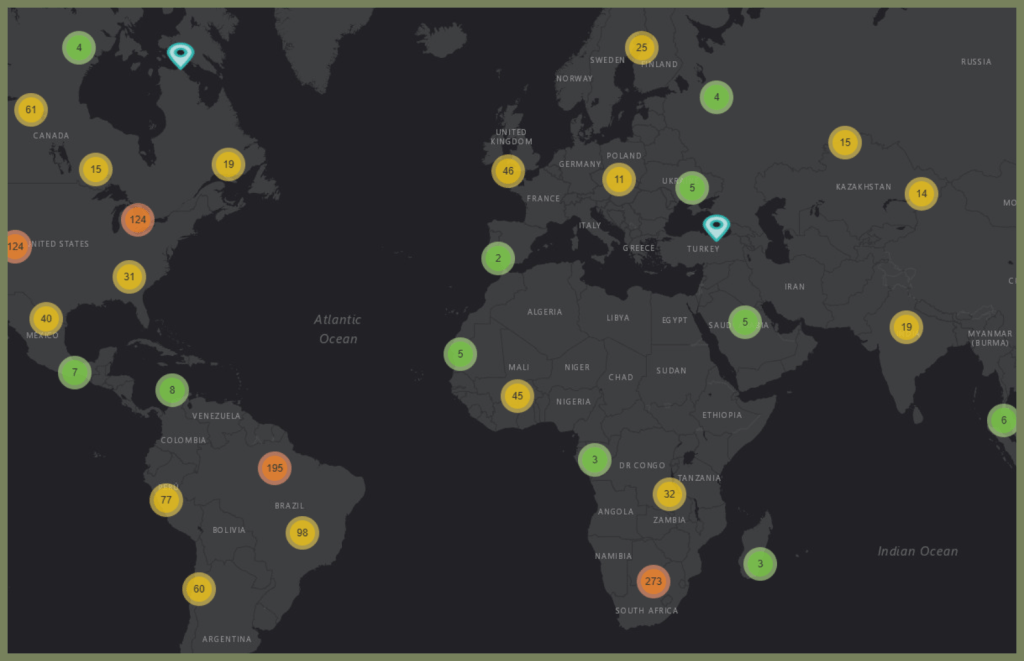
Explore examples of environmental harm in Ukraine
CEOBS has been remotely tracking and assessing environmentally-relevant incidents in Ukraine since February 2022. We share our data with relevant stakeholders and it also informs our research and advocacy activities. This interactive map features 25 incidents from our database that help illustrate some of the types of environmental damage that have been caused or exacerbated by the conflict.

Tap to drop a raindrop anywhere in the world and watch where it ends up! A visualisation by Sam Learner, which comes from the River Runner API, which is based on several open source projects and datasets and developed by Dave Blodgett, Kyle Onda, and Ben Webb. Learn about it here.
This portal brings together all of the disclosures that mining companies have made about their tailings storage facilities. It gives communities, investors, regulators and the media unprecedented access to information about mine waste. Under their “Explore Data” tab, you can find information on ownership, volume, construction, and location of tailings facilities.
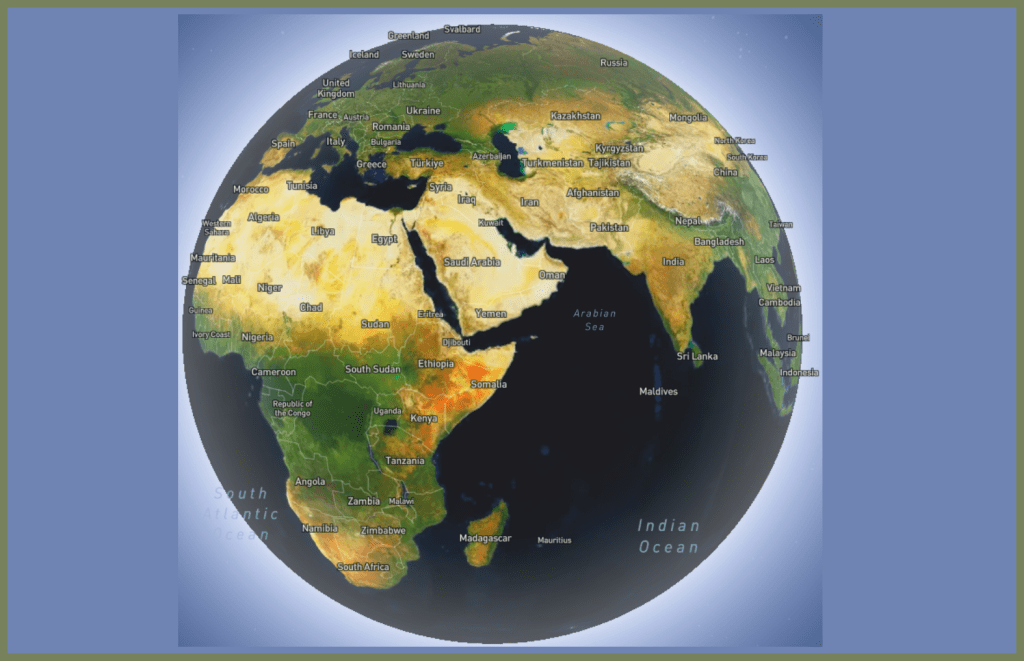
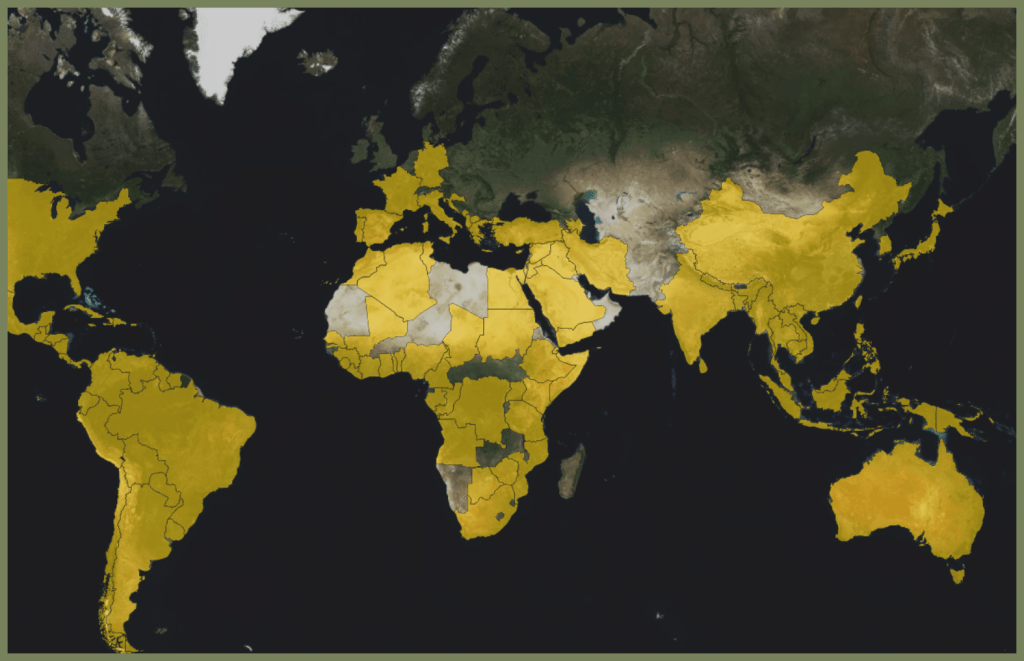
The Global Plastic Watch (GPW) is a digital platform that maps the world’s plastic pollution in near real-time using a unique combination of satellite imagery and artificial intelligence.
You can explore the map HERE.
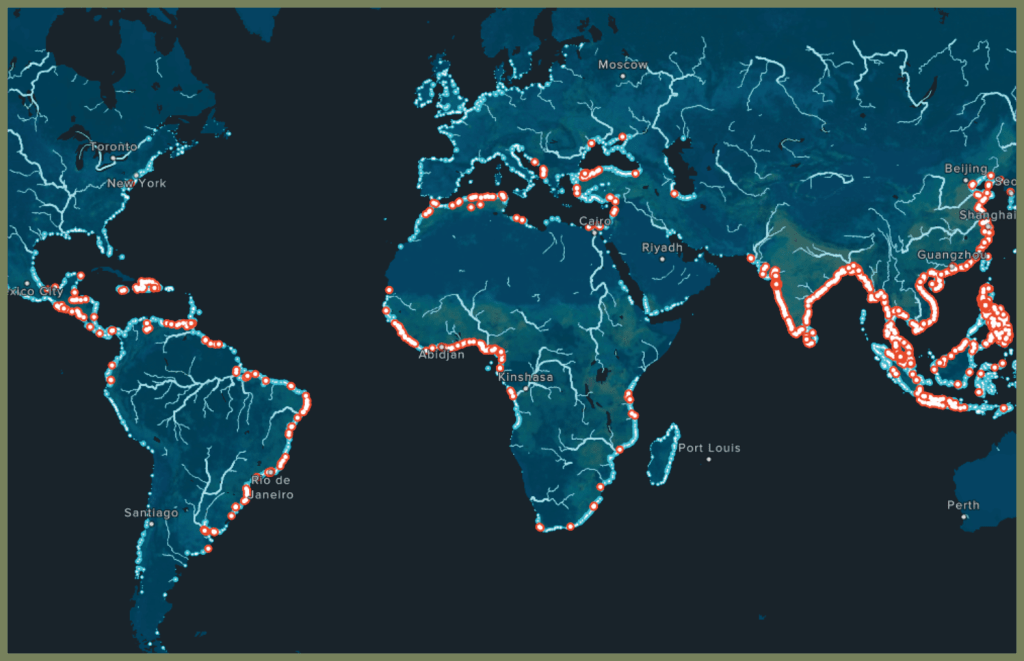
The map shows river plastic emissions to the world’s oceans. It’s estimated that the 1000 rivers, represented by the red dots, are accountable for nearly 80% of global annual riverine plastic emissions. The findings displayed in this map have been published in the journal Science Advances.